Case Studies

Proof in the numbers

Real results from startups and scale-ups that bet on data — and won.

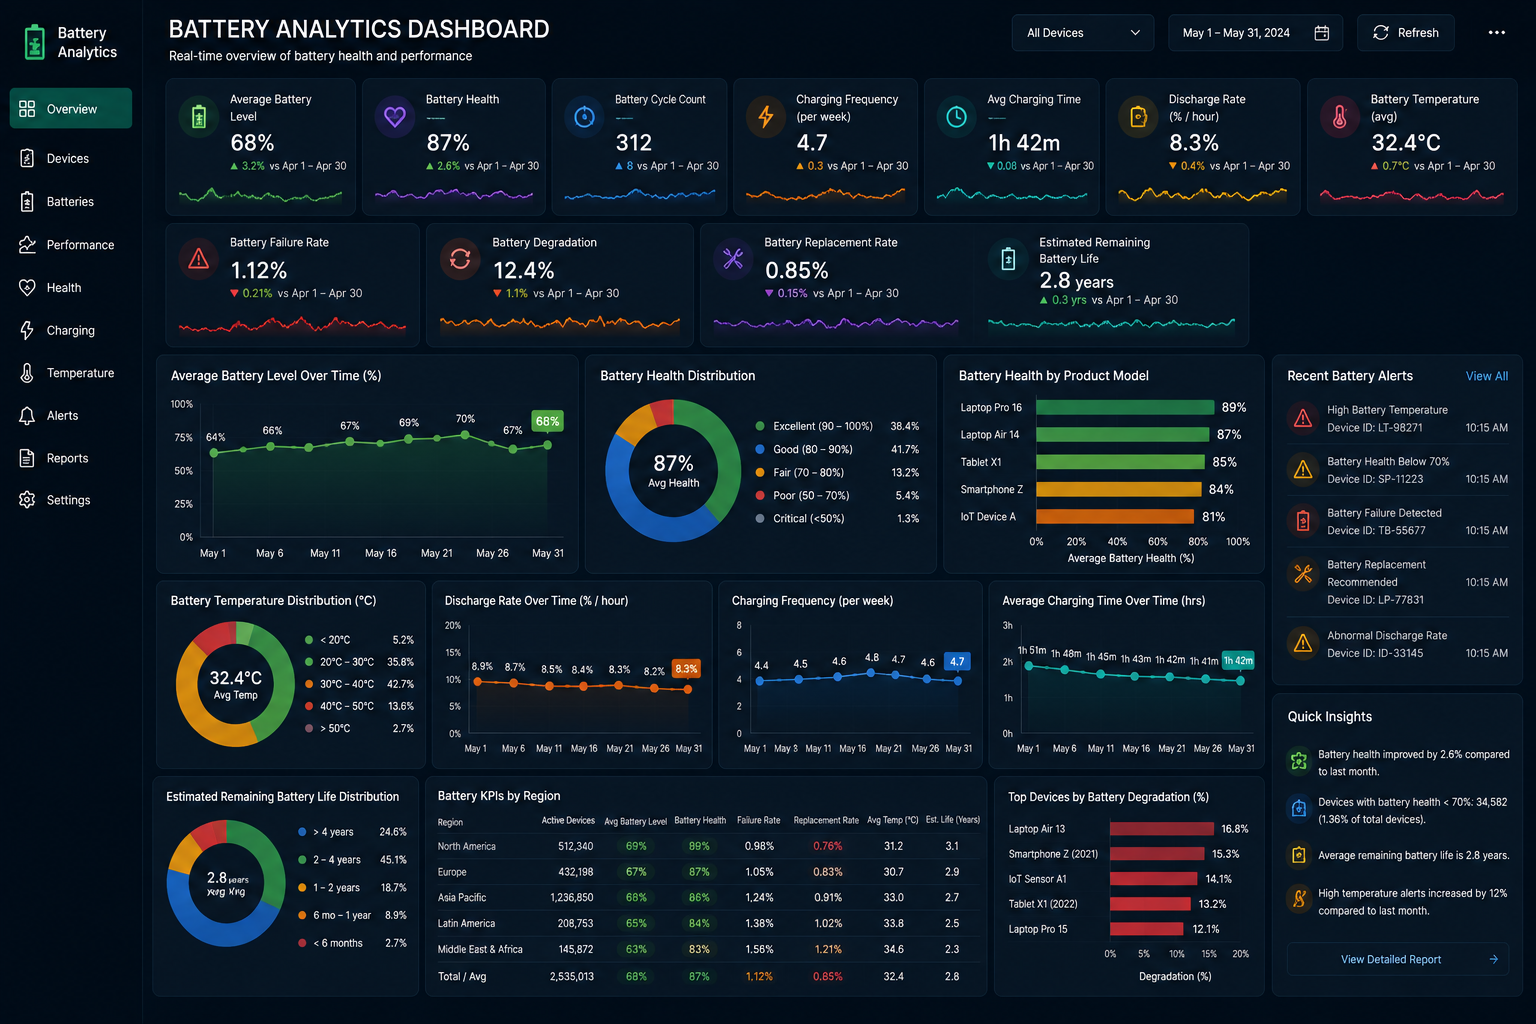
EV & Clean Energy dashboard
EV & Clean EnergyElectric vehicle manufacturer

No real-time visibility into battery health across 2.5M+ deployed devices — failures were discovered only after customer complaints

We built a real-time battery analytics platform on Databricks, ingesting telemetry from 2.5M+ devices. The dashboard tracks degradation curves, failure rates, and estimated remaining life per unit — enabling proactive field interventions before failures occur.

Data EngineeringAnalytics & BI

Results

2.5M+Devices monitored in real time
67%Reduction in field failure incidents
4 wksTime to production deployment
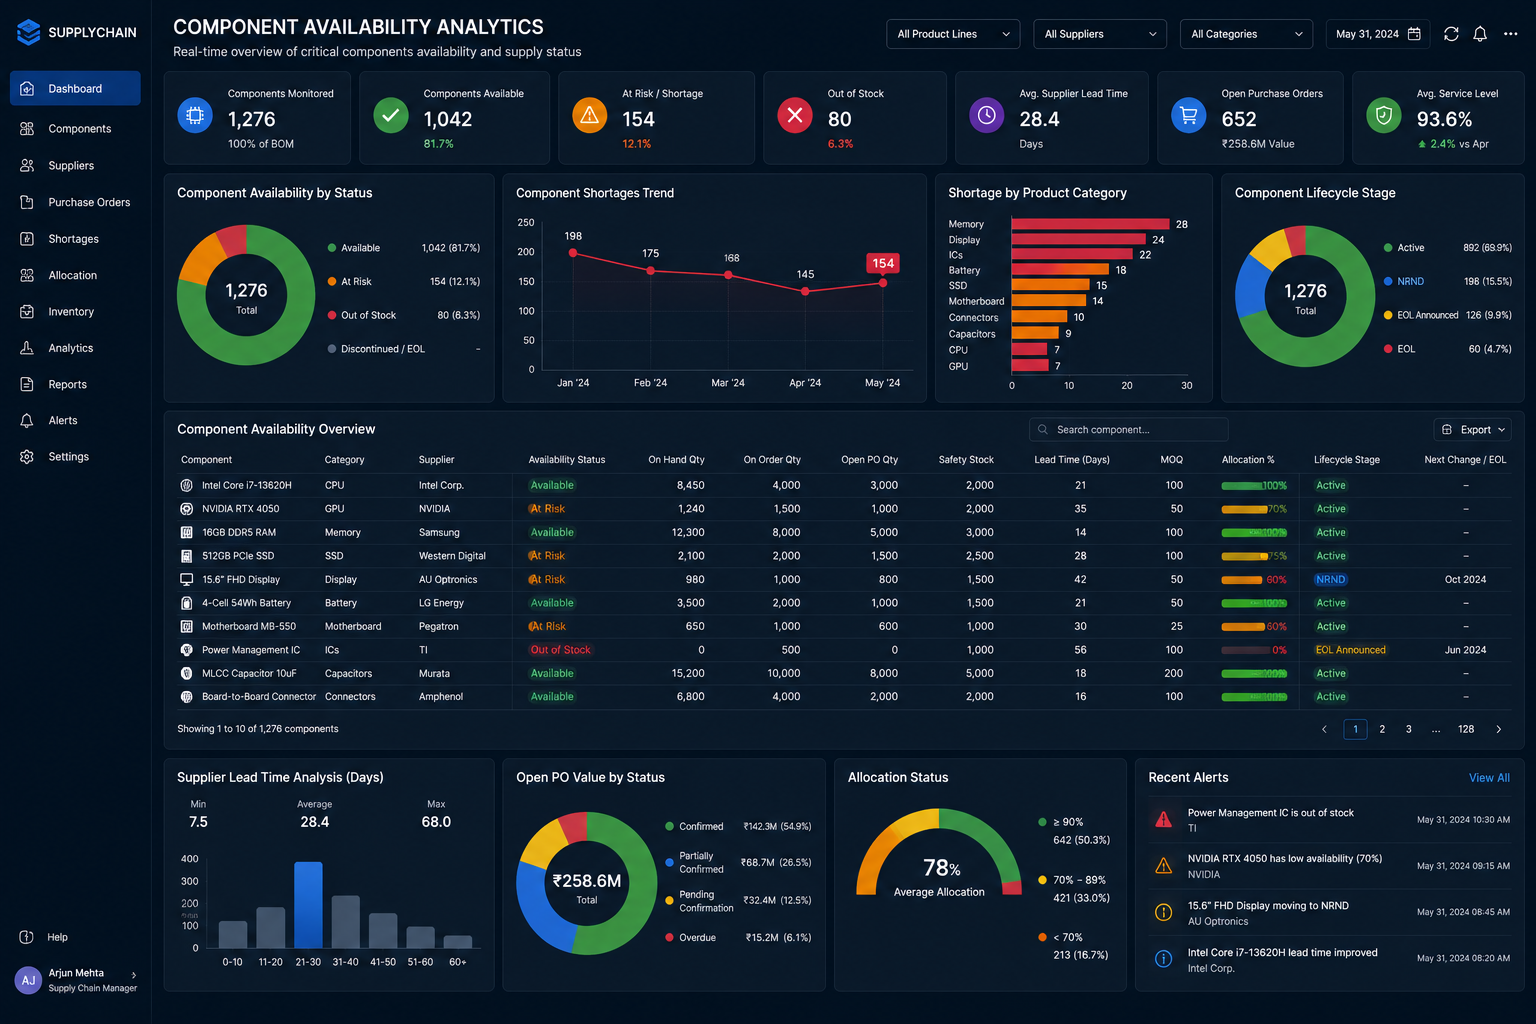
Manufacturing dashboard
ManufacturingElectronics components supplier

Supply chain teams had no single view of component availability — shortages were discovered too late, causing production line stoppages

We unified data from 12 supplier systems into a Snowflake warehouse and built a component availability dashboard tracking 1,276 parts. At-risk components, lead time changes, and shortage alerts are now surfaced 3–4 weeks in advance.

Data EngineeringInsights & Strategy

Results

1,276Components tracked in one view
3–4 wksEarlier shortage detection
41%Reduction in production stoppages
B2B SaaS dashboard
B2B SaaSEnterprise software platform

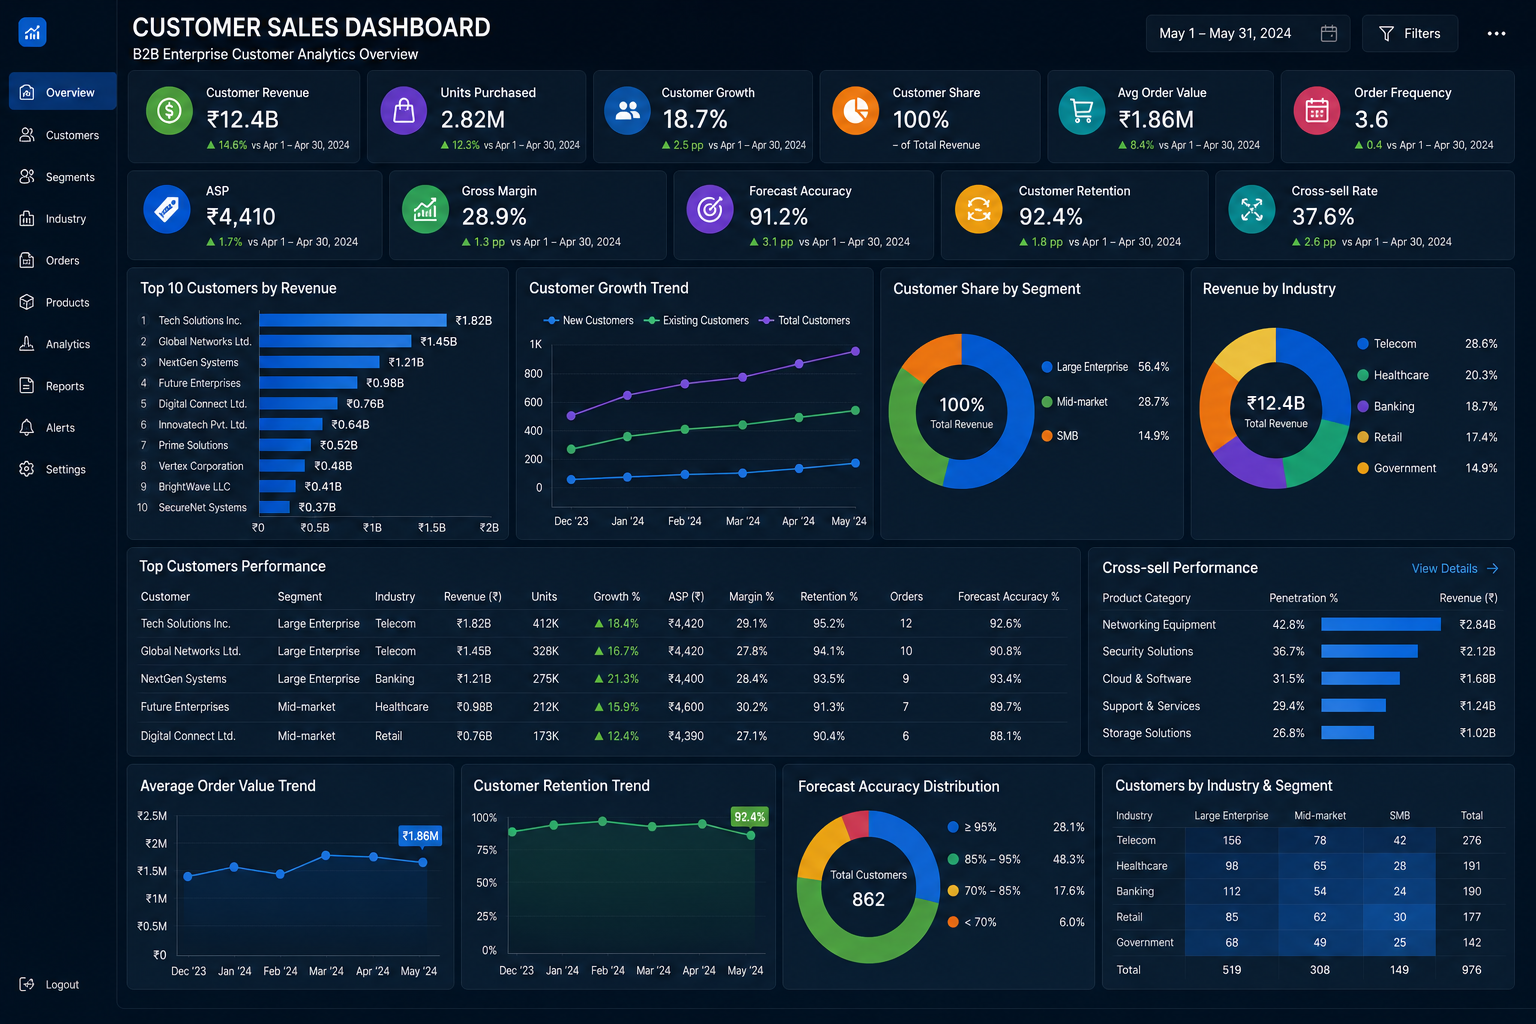
Sales and customer success teams were working from separate spreadsheets — no unified view of revenue, retention, or cross-sell opportunity by customer

We built a B2B customer analytics platform covering revenue trends, cohort retention, and cross-sell performance. The Power BI dashboard integrates CRM, billing, and product usage data into a single customer health view.

Analytics & BIInsights & Strategy

Results

2.4×Improvement in customer LTV
28%Increase in cross-sell revenue
5 daysSaved per month in manual reporting
Retail & E-commerce dashboard
Retail & E-commerceOmnichannel retail group

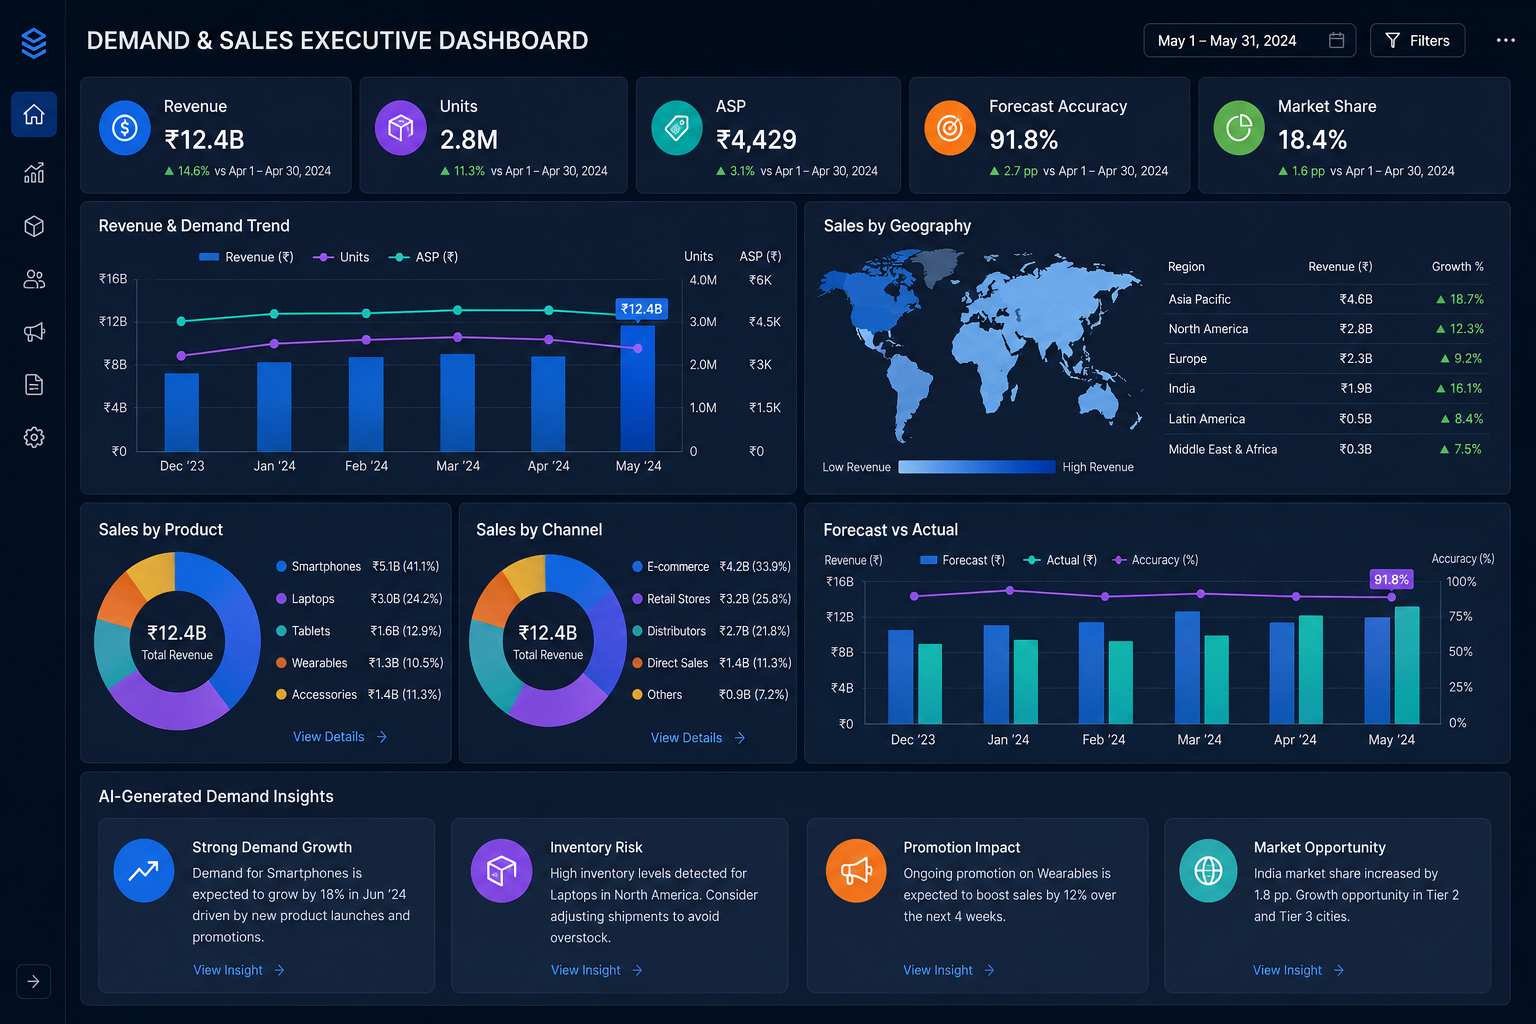
Demand forecasting was based on gut feel — overstock and stockout events were costing millions annually with no data-driven planning process

We built an executive demand and sales dashboard with AI-generated demand insights, forecast vs. actual tracking, and geography breakdowns. The platform integrates POS, warehouse, and marketing data to give leadership a single planning view.

Analytics & BIML & Predictive Models

Results

31%Reduction in overstock costs
19%Improvement in forecast accuracy
$2.1MAnnual savings identified
IoT & Connected Devices dashboard
IoT & Connected DevicesGlobal IoT platform provider

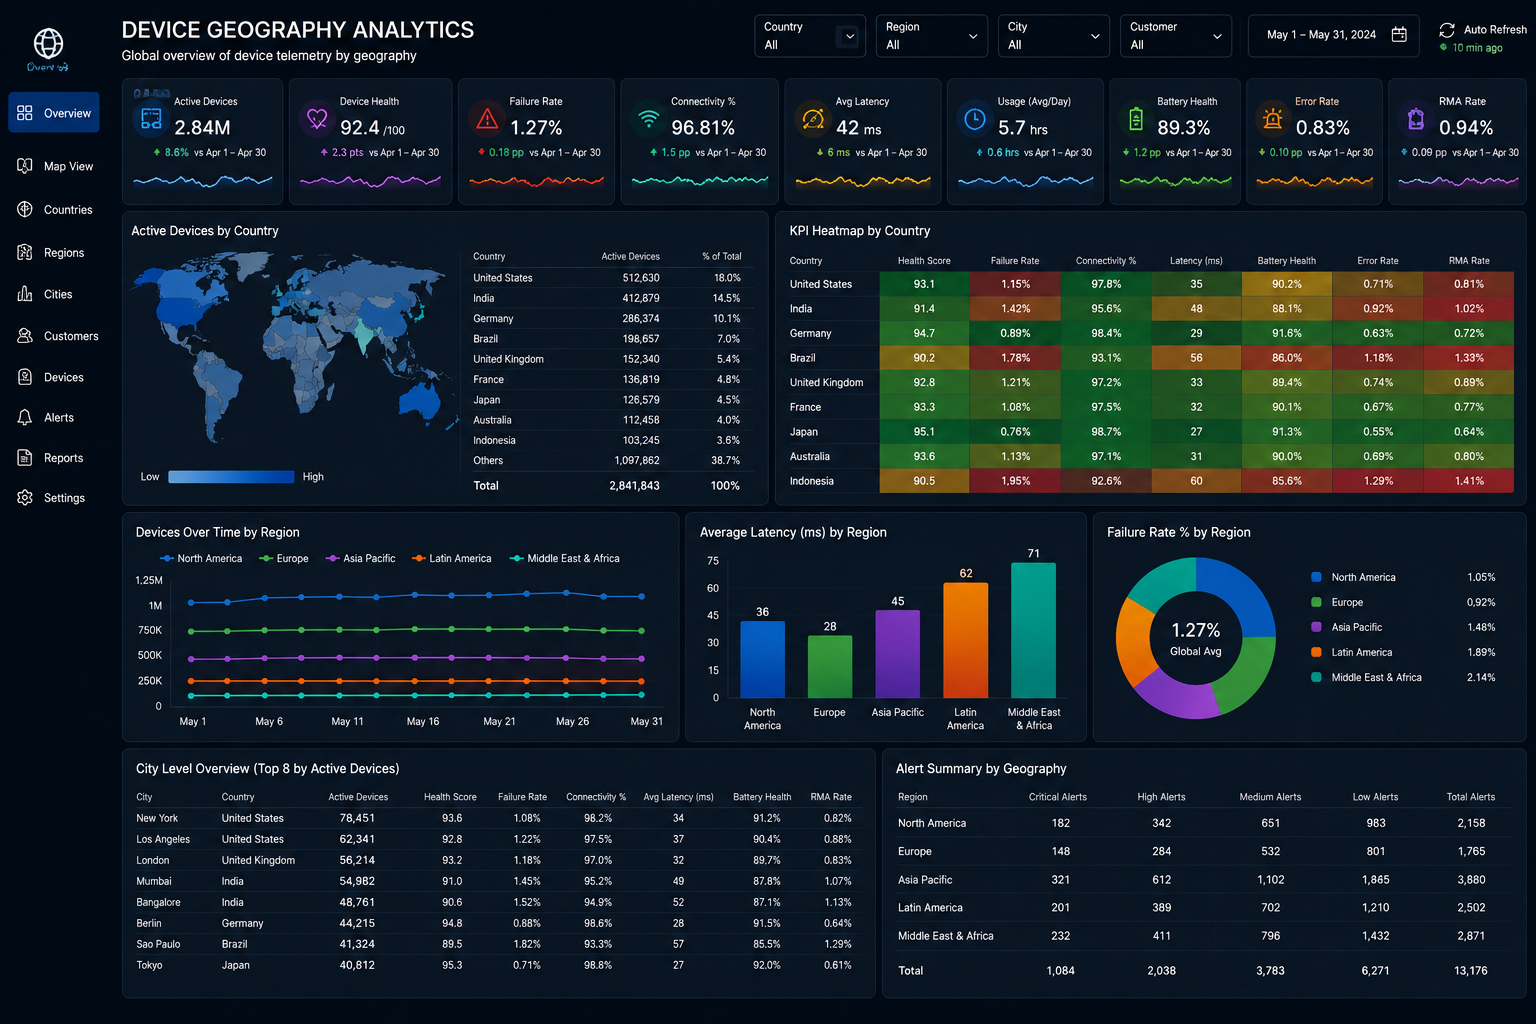
Device health data was siloed by region — operations teams had no global view of connectivity, failure rates, or firmware compliance across 2.84M active devices

We built a geography analytics platform on Databricks that maps 2.84M IoT devices by health score, failure rate, and connectivity across all regions. Regional ops teams now have drill-down visibility from global overview to individual device level.

Data EngineeringAnalytics & BI

Results

2.84MDevices mapped globally
52%Faster incident response time
8 regionsUnified into one platform
Industrial IoT dashboard
Industrial IoTSmart infrastructure operator

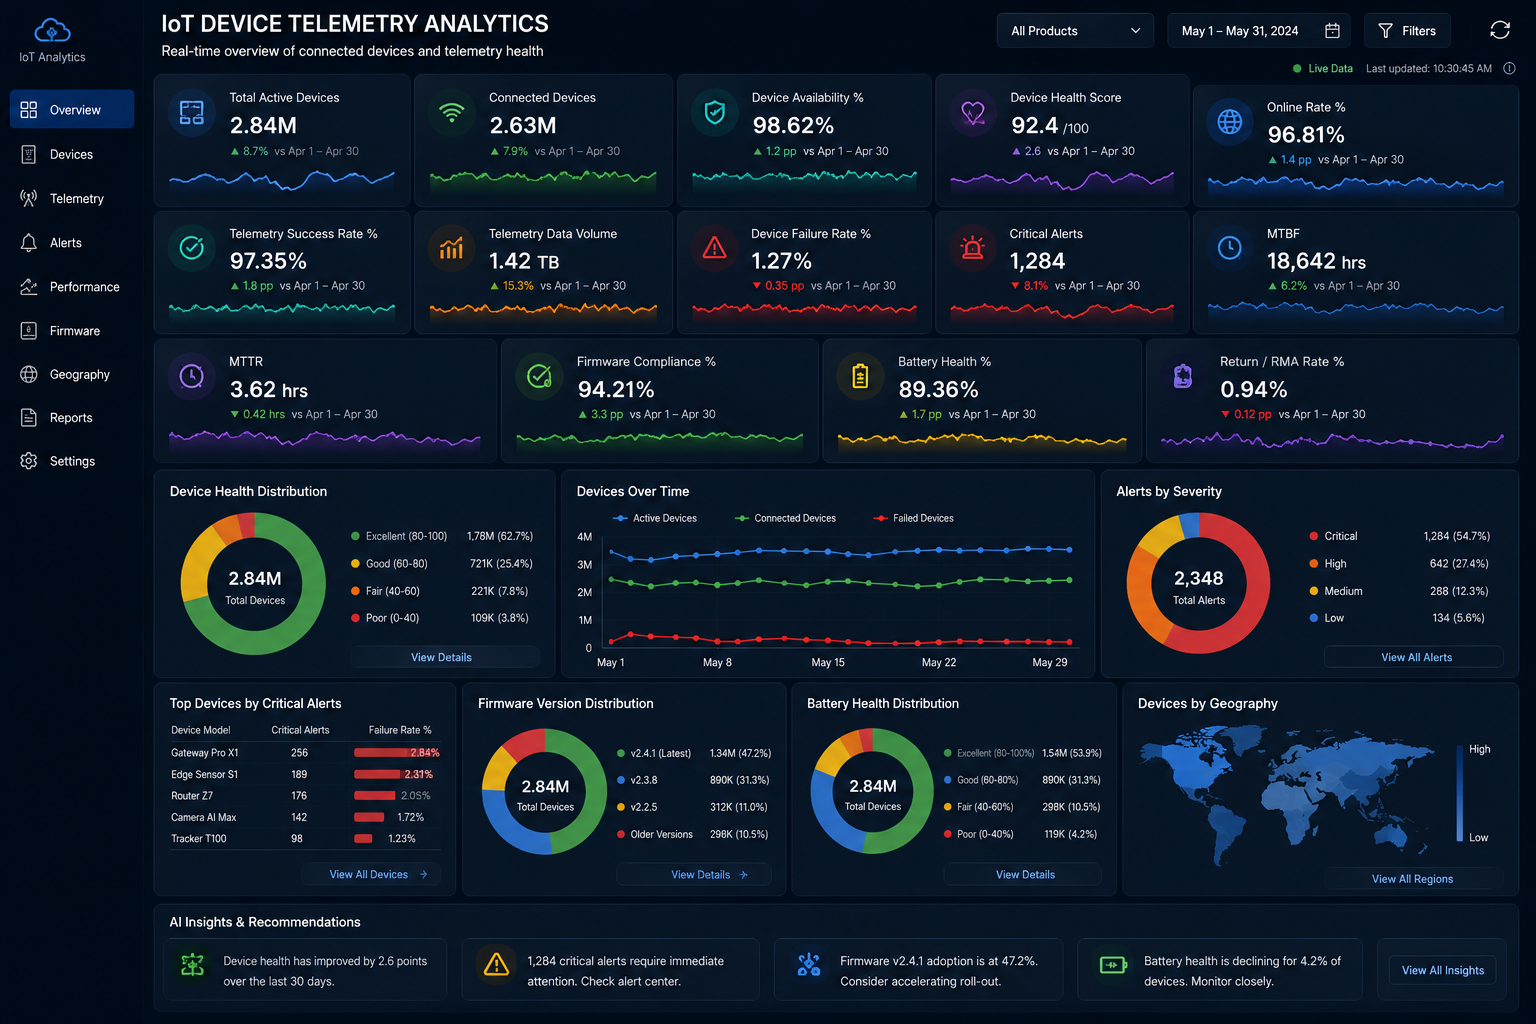
IoT telemetry was being collected but never acted on — MTTR was high, firmware compliance was unknown, and alert fatigue was causing critical issues to be missed

We built an end-to-end IoT telemetry health dashboard monitoring 2.84M devices with firmware compliance tracking, MTTR benchmarking, and alert severity triage. Critical alerts are now routed automatically to the right team within minutes.

Data EngineeringInsights & Strategy

Results

44%Reduction in mean time to resolve
98.6%Firmware compliance achieved
Faster critical alert response
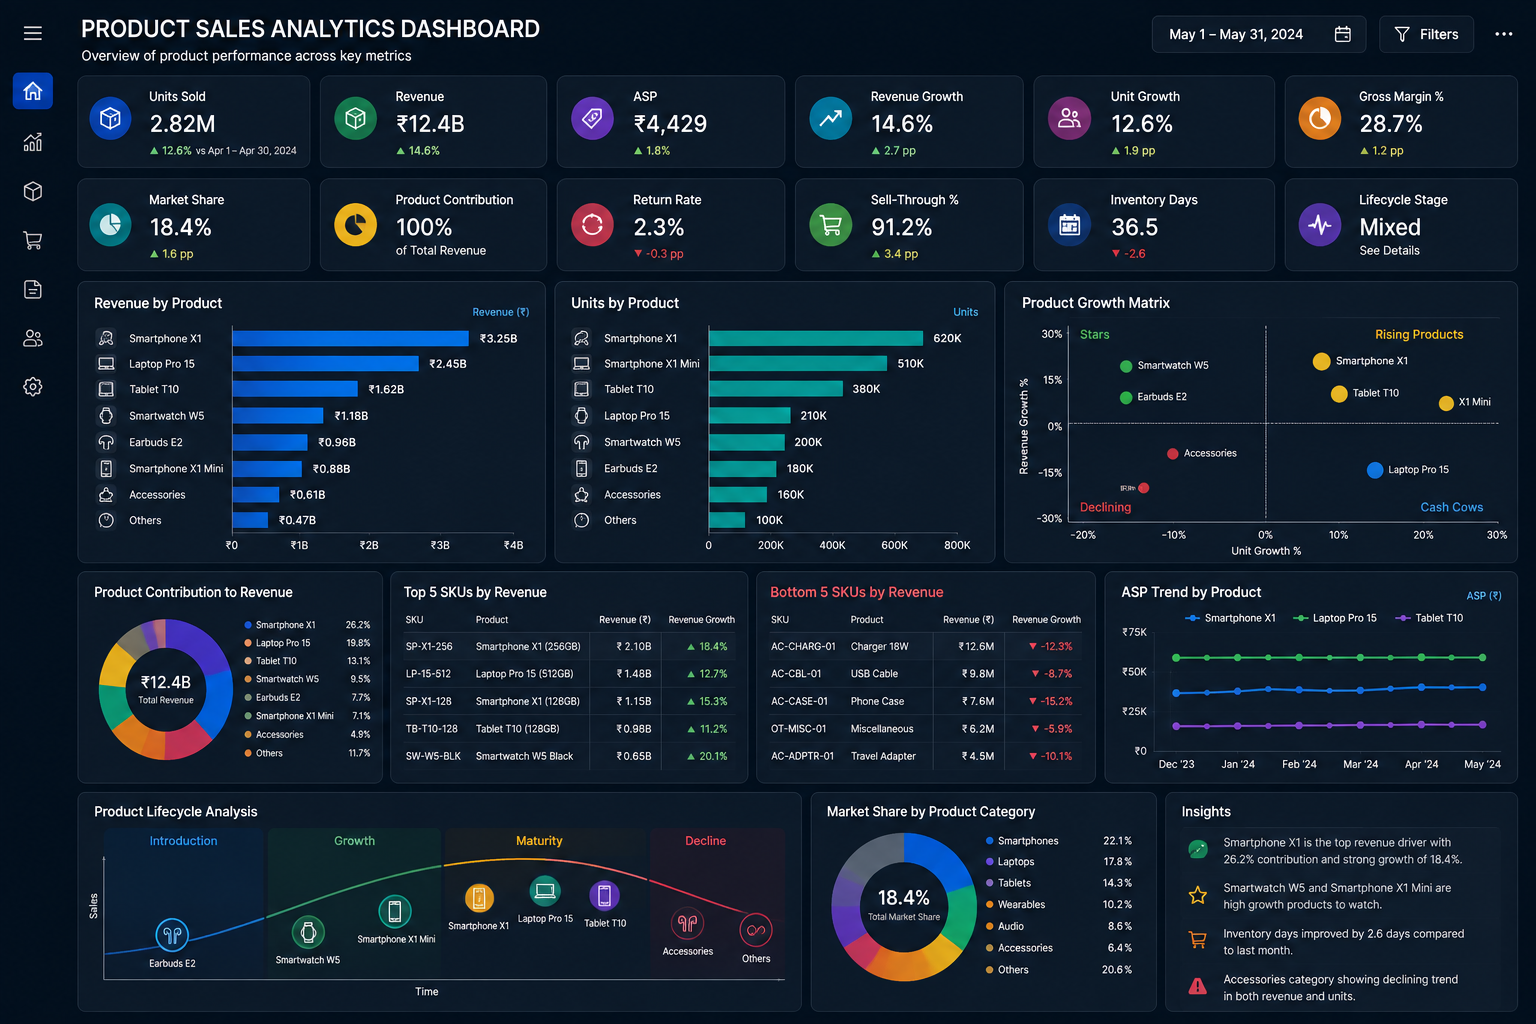
Consumer Goods dashboard
Consumer GoodsMulti-brand FMCG company

Product performance was tracked in spreadsheets — no lifecycle analysis, no SKU-level sell-through visibility, and no way to identify which products to scale or discontinue

We built a product sales analytics platform in Tableau covering lifecycle stage analysis, a growth matrix, and SKU-level sell-through metrics. The platform integrates sales, returns, and margin data to give category managers a complete product performance view.

Analytics & BIInsights & Strategy

Results

23%Increase in top-SKU revenue
17%Reduction in slow-moving inventory
6 wksTime to full deployment

Want results like these?

Tell us about your data challenge.

Infizeon

Turning complex data into clear, actionable intelligence for startups and scale-ups.

Available for new projects

Services

  • Data Engineering
  • Analytics & BI
  • Insights & Strategy
  • Data Infrastructure
  • ML & Predictive Models

© 2026 Infizeon. All rights reserved.

Privacy PolicyTerms of Service